Tables and Bar Graphs
What are bar graphs / bar charts?
Bar graphs or bar charts are visual display of data using bars of different size. It can be horizontal or vertical bars.
Why do we use tables and bar graphs?
Data are presented in a table to make it easier to compare and interpret them.
The information in a table can be displayed using bars in a diagram called a bar graph or bar chart. The length of bars changes with the value of data.
The information in a table can be displayed using bars in a diagram called a bar graph or bar chart. The length of bars changes with the value of data.
2. Meryl made a bouquet using the following flowers.
a. Show the data in the diagram below using a table.
b. Draw a bar graph to present the information in the table in part a.

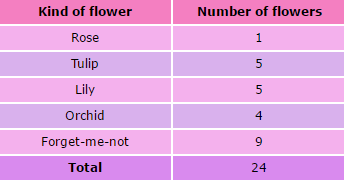
a. Data in the figure above can be presented using a table like this:
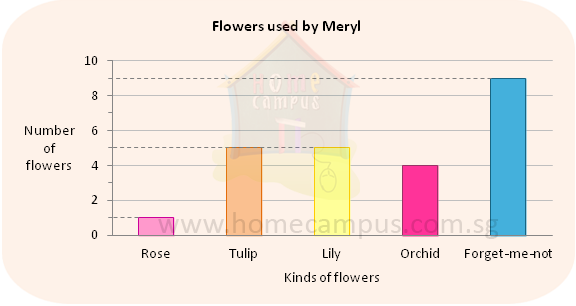
b. The information in the table above can be presented in a bar graph as below.
3. Using the information in question 2 above, answer the following:
a. Which was the most common flower in the bouquet?
Answer: Forget-me-not
b. Which was the least common flower in the bouquet?
Answer: Rose
c. Which 2 kinds of flowers were used in equal numbers?
Answer: Tulip and Lily
d. How many flowers had the bouquet?
Answer: 1 + 5 + 5 + 4 + 9 = 24
Answer: Forget-me-not
b. Which was the least common flower in the bouquet?
Answer: Rose
c. Which 2 kinds of flowers were used in equal numbers?
Answer: Tulip and Lily
d. How many flowers had the bouquet?
Answer: 1 + 5 + 5 + 4 + 9 = 24
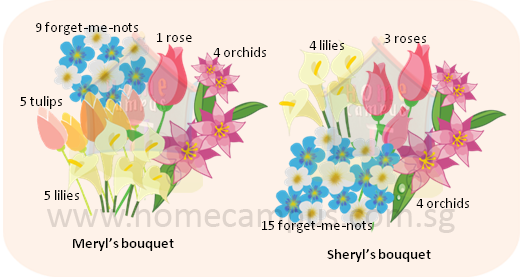
4. Meryl and Sheryl each made a bouquet using the following flowers.
a. Show the data in the diagram below using a table.
b. Draw a bar graph to present the information in the table in part a.
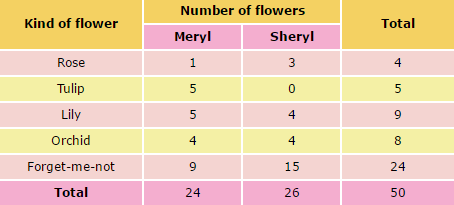
a. Data in the figure above can be presented using a table like this:
b. The information in the table above can be presented in a bar graph as below.
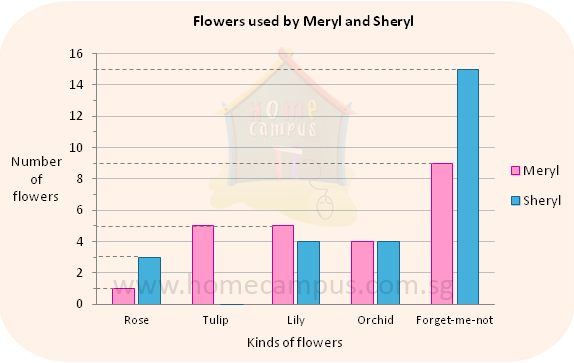
5. Using the information in question 4 above, answer the following:
a. Which was the most common kind of flower used by the two girls?
Answer: Forget-me-not
b. How many lilies did the 2 girls use together?
Answer: 5 + 4 = 9
c. Who had more flowers in her bouquet? How many more flowers did she have?
Answer: Sheryl had more flowers in her bouquet. She had 2 more flowers.
d. What was the total number of flowers used by the 2 girls?
Answer: 4 + 5 + 9 + 8 + 24 = 50
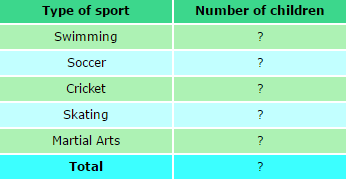
6. 80 children were asked to name their favourite sport. The following bar graph shows their choice.
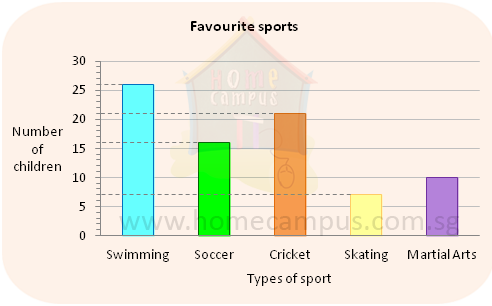
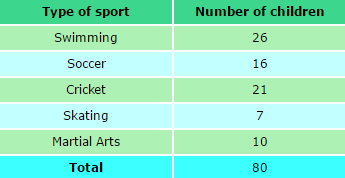
a. Complete the following table using the data from the graph above.
b. Which were the 2 most popular sports?
Answer: Swimming and Cricket
c. Which was the least popular sport?
Answer: Skating
d. How many more children chose swimming than martial arts as their favourite sport?
Answer: 26 − 10 = 16
e. How many times as many children chose cricket than skating as their favourite sport?
Answer: 21 ÷ 7 = 3
3 times as many children chose cricket than skating as their favourite sport.
7. The table below shows the number of 50¢ parking coupons and $1 parking coupons that 5 people used in a certain week.
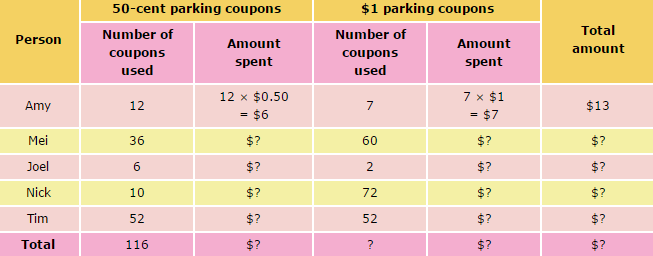
a. Complete the table shown above.
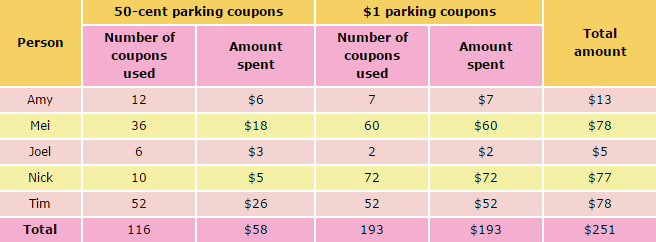
b. Who used the most number of parking coupons? How many?
Tim used the most number of parking coupons.
52 + 52 = 104
He used 104 parking coupons.
c. Who spent the most amount of money on parking?
Mei and Tim
d. Who spent the least amount of money on parking?
Joel
e. Which two people spent the same amount of money on parking in the week? What was the amount?
Mei and Tim spent the same amount of money on parking in the week. The amount was $78.
f. How many more parking coupons did Nick use than Amy? How much more amount did Nick spend than Amy?
Nick => 10 + 72 = 82
Amy => 12 + 7 = 19
82 − 19 = 63
Nick used 63 more parking coupons than Amy.
$77 − $13 = $64
Nick spent $64 more than Amy.
g. How many more $1 parking coupons than 50-cent parking coupons were used altogether?
193 − 116 = 77
There were 77 more $1 parking coupons than 50-cent parking coupons used altogether.
h. How much money was spent altogether on parking in the week?
$251