Reading and Interpreting Bar Graphs
What is a bar graph?
The information in a table can be displayed using bars in a diagram called a bar graph or bar chart. The length of bars changes with the value of data. Bars can be plotted horizontally or vertically.
1. The following bar graph shows the number of books in various categories in a kids' library.
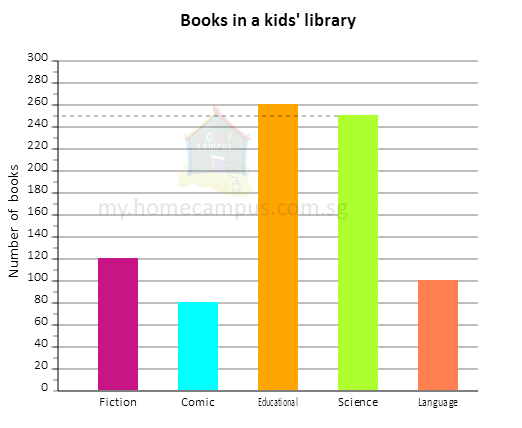
a. How many books are there in the Science category?
The height of the bar for Science is 250.So, there are 250 books in the Science category.
b. Which category of books are the most common books in the library?
The tallest bar in the graph is for Educational (260 books).So, Educational books are the most common books in the library.
c. Which category of books are the least common books in the library?
The shortest bar in the graph is for Comic (80 books).So, Comic books are the least common books in the library.
d. There are _____ more books in the Fiction category than in the Language category.
Number of books in the Fiction category = 120Number of books in the Language category = 100
120 − 100 = 20
There are 20 more books in the Fiction category than in the Language category.
2. Lynn drew a bar graph to show the number of maths questions she solved from Monday to Friday last week.
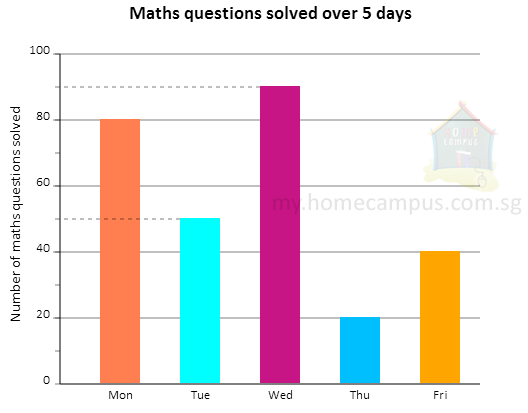
a. How many questions did she solve on Friday?
The height of the bar for Friday is 40.So, she solved 40 questions on Friday.
b. On which day did she solve the most number of questions? How many questions did she solve that day?
The tallest bar in the graph is for Wednesday.So, she solved the most number of questions on Wednesday.
The height of the bar for Wednesday is 90.
So, she solved 90 questions on Wednesday.
c. On which day did she solve 30 more questions than on Thursday?
Number of questions solved on Thursday = 2030 more questions than 20 = 30 + 20 = 50
50 is the height of the bar for Tuesday.
She solved 30 more questions on Tuesday than on Thursday.
d. How many fewer questions did she solve on Friday than on Wednesday?
Number of questions solved on Wednesday = 90Number of questions solved on Friday = 40
90 − 40 = 50
She solved 50 fewer questions on Friday than on Wednesday.
e. On Monday she solved 68 questions correctly. How many questions did she get wrong on Monday?
Total number of questions solved on Monday = 80Number of questions solved correctly on Monday = 68
80 − 68 = 12
She got 12 questions wrong on Monday.
3. Five friends played a video game and scored some points.
Their scores are shown in the bar graph below.
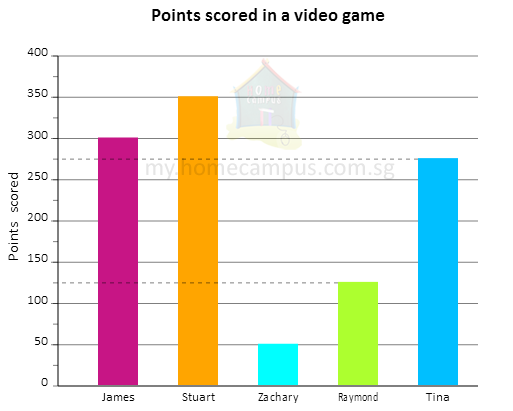
a. How many points did James score?
The height of the bar for James is 300.So, James scored 300 points.
b. Who scored 275 points in the video game?
275 is the height of the bar for Tina.So, Tina scored 275 points in the video game.
c. How many more points should Zachary score to equal Raymond's score?
Raymond's score = 125Zachary's score = 50
125 − 50 = 75
Zachary should score 75 more points to equal Raymond's score.