Line Graphs - Reading and Interpreting
1. What is a line graph?
A line graph or a line chart is a type of chart.
It displays data as points which are connected to show trends.
It displays data as points which are connected to show trends.
2. Reading and Interpreting Line Graphs
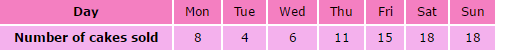
The table below shows the number of cakes that a bakery sold last week.
The line graph below shows the information given in the table above.
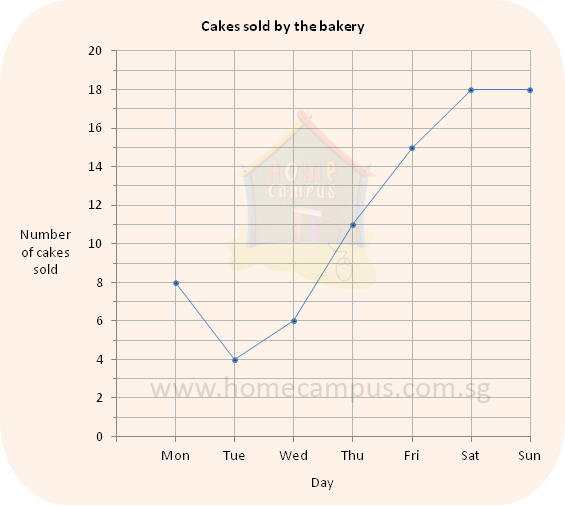
The line graph tells us the following things:
The line graph below shows the information given in the table above.
The line graph tells us the following things:
- The bakery sold the least number of cakes on Tuesday (the lowest point is on Tuesday)
- The bakery sold the same number of cakes on Saturday and Sunday (both Saturday and Sunday are at the same level)
- The bakery sold the most number of cakes over the weekend (the highest points are on Saturday and Sunday)
- There was a decrease in the number of cakes sold from Monday to Tuesday (this is called a dip in the graph)
- After Tuesday, the number of cakes that the bakery sold increased each day till Saturday (this is known as an upward trend as the line goes up)
3. The following line graph shows Ria's height from birth to 30 years of age.
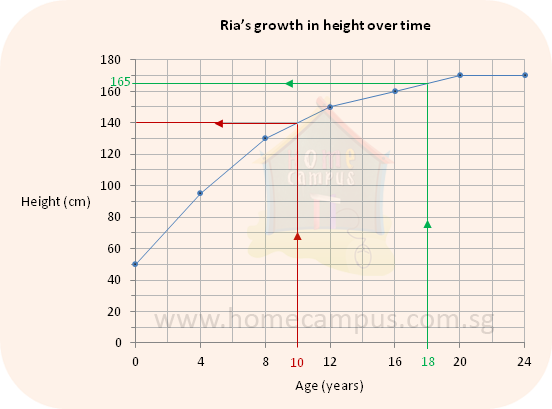
a. What was Ria's height at the age of 10?
Step 1: Find 10 years on the horizontal axis (Age scale).
Step 2: Move up the red arrow until you meet the line graph. (Follow the red lines)
Step 3: Next, move left until you meet the vertical axis (Height scale).
Step 4: The reading on the Height scale will give you Ria's height at the age of 10.
Answer: Ria's height was 140 cm at the age of 10.
b. What was Ria's height when she was 18 years old?
Ria's height was 165 cm when she was 18 years old.(Follow the green lines)
c. How many centimetres did she gain from the age of 8 to the age of 16?
Height at the age of 8 = 130 cm
Height at the age of 16 = 160 cm
Increase in height = 160 cm − 130 cm = 30 cm
She gained 30 cm from the age of 8 to the age of 16.
d. What does the flat line on the graph from the ages of 20 to 24 mean?
It means that her height had stabilized at the age of 20, or in other words, there was no progress in height after the age of 20. Such a flat line on the graph is known as a plateau.
4. The graph below shows the price of different lengths of lace at a shop.
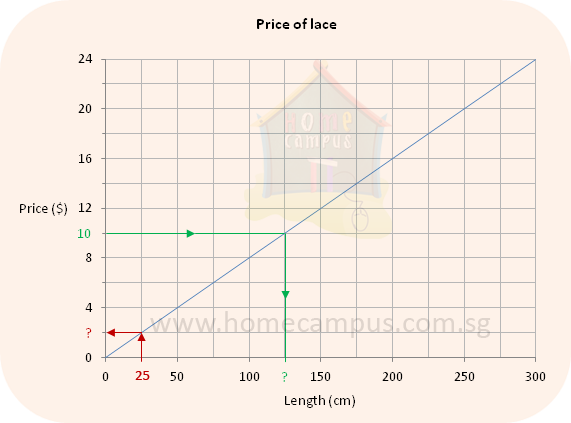
a. Find the price of 200 cm of lace.
$16
b. Find the price of 25 cm of lace.
$2 (Follow the red lines)
c. Jane paid $8 for some lace. How many centimetres of lace did she buy?
100 cm
d. Jill paid $10 for some lace. How many centimetres of lace did she buy?
Step 1: Find $10 on the vertical axis (Price scale).
Step 2: Move right on the green arrow until you meet the line graph. (Follow the green lines)
Step 3: Next, move down the green arrow until you meet the horizontal axis (Length scale).
Step 4: The reading on the Length scale will give you the answer.
Answer: She bought 125 cm of lace.
e. Ruby bought 150 cm of lace. Zuby bought 275 cm of lace.
How much did they pay for the lace altogether?
150 cm of lace costs $12.
275 cm of lace costs $22.
$12 + $22 = $34
They paid $34 for the lace altogether.
f. Binu bought 250 cm of lace and gave $50 to the cashier.
How much change must the cashier return to Binu?
250 cm of lace costs $20.
$50 − $20 = $30
The cashier must return $30 to Binu.